Linux
| A Software That Controls The Brightness Of Your Linux Computer Screen | ||||||||||||
| ||||||||||||

These Books Will Help You Learn More About Linux | ||||||||||||
| ||||||||||||

12 Command Line Tools to Monitor Linux Performance
It’s really very tough job for every System or Network administrator to monitor and debugLinux System Performance problems every day. After being a Linux Administrator for 5 years in IT industry, I came to know that how hard is to monitor and keep systems up and running. For this reason, we’ve compiled the list of Top 12 frequently used command linemonitoring tools that might be useful for every Linux/Unix System Administrator. These commands are available under all flavors of Linux and can be useful to monitor and find the actual causes of performance problem. This list of commands shown here are very enough for you to pick the one that is suitable for your monitoring scenario.

12 Linux Monitoring Tools
1. Top – Linux Process Monitoring
Linux Top command is a performance monitoring program which is used frequently by many system administrators to monitor Linux performance and it is available under many Linux/Unixlike operating systems. The top command used to dipslay all the running and active real-time processes in ordered list and updates it regularly. It display CPU usage, Memory usage, Swap Memory, Cache Size, Buffer Size, Process PID, User, Commands and much more. It also shows high memory and cpu utilization of a running processess. The top command is much userful for system administrator to monitor and take correct action when required. Let’s see top command in action.
# top

Top Command Example
2. VmStat – Virtual Memory Statistics
Linux VmStat command used to display statistics of virtual memory, kernerl threads, disks,system processes, I/O blocks, interrupts, CPU activity and much more. By default vmstat command is not available under Linux systems you need to install a package called sysstat that includes a vmstat program. The common usage of command format is.
# vmstat

procs -----------memory---------- ---swap-- -----io---- --system-- -----cpu-----
 r  b   swpd   free  inact active   si   so    bi    bo   in   cs us sy id wa st
 1  0      0 810420  97380  70628    0    0   115     4   89   79  1  6 90  3  0
3. Lsof – List Open Files
Lsof command used in many Linux/Unix like system that is used to display list of all the open files and the processes. The open files included are disk files, network sockets, pipes,devices and processes. One of the main reason for using this command is when a disk cannot be unmounted and displays the error that files are being used or opened. With this commmand you can easily identify which files are in use. The most common format for this command is.
# lsof

COMMAND     PID      USER   FD      TYPE     DEVICE     SIZE       NODE NAME
init          1      root  cwd       DIR      104,2     4096          2 /
init          1      root  rtd       DIR      104,2     4096          2 /
init          1      root  txt       REG      104,2    38652   17710339 /sbin/init
init          1      root  mem       REG      104,2   129900     196453 /lib/ld-2.5.so
init          1      root  mem       REG      104,2  1693812     196454 /lib/libc-2.5.so
init          1      root  mem       REG      104,2    20668     196479 /lib/libdl-2.5.so
init          1      root  mem       REG      104,2   245376     196419 /lib/libsepol.so.1
init          1      root  mem       REG      104,2    93508     196431 /lib/libselinux.so.1
init          1      root   10u     FIFO       0,17                 953 /dev/initctl
4. Tcpdump – Network Packet Analyzer
Tcpdump one of the most widely used command-line network packet analyzer or packets sniffer program that is used capture or filter TCP/IP packets that received or transferred on a specific interface over a network. It also provides a option to save captured packages in a file for later analysis. tcpdump is almost available in all major Linux distributions.
# tcpdump -i eth0

tcpdump: verbose output suppressed, use -v or -vv for full protocol decode
listening on eth0, link-type EN10MB (Ethernet), capture size 96 bytes
22:08:59.617628 IP tecmint.com.ssh > 115.113.134.3.static-mumbai.vsnl.net.in.28472: P 2532133365:2532133481(116) ack 3561562349 win 9648
22:09:07.653466 IP tecmint.com.ssh > 115.113.134.3.static-mumbai.vsnl.net.in.28472: P 116:232(116) ack 1 win 9648
22:08:59.617916 IP 115.113.134.3.static-mumbai.vsnl.net.in.28472 > tecmint.com.ssh: . ack 116 win 64347
5. Netstat – Network Statistics
Netstat is a command line tool for monitoring incoming and outgoing network packets statistics as well as interface statistics. It is very useful tool for every system administrator to monitor network performance and troubleshoot network related problems.
# netstat -a | more

Active Internet connections (servers and established)
Proto Recv-Q Send-Q Local Address               Foreign Address             State
tcp        0      0 *:mysql                     *:*                         LISTEN
tcp        0      0 *:sunrpc                    *:*                         LISTEN
tcp        0      0 *:realm-rusd                *:*                         LISTEN
tcp        0      0 *:ftp                       *:*                         LISTEN
tcp        0      0 localhost.localdomain:ipp   *:*                         LISTEN
tcp        0      0 localhost.localdomain:smtp  *:*                         LISTEN
tcp        0      0 localhost.localdomain:smtp  localhost.localdomain:42709 TIME_WAIT
tcp        0      0 localhost.localdomain:smtp  localhost.localdomain:42710 TIME_WAIT
tcp        0      0 *:http                      *:*                         LISTEN
tcp        0      0 *:ssh                       *:*                         LISTEN
tcp        0      0 *:https                     *:*                         LISTEN
6. Htop – Linux Process Monitoring
Htop is a much advanced interactive and real time Linux process monitoring tool. This is much similar to Linux top command but it has some rich features like user friendly interface to manage process, shortcut keys, vertical and horizontal view of the processes and much more. Htop is a third party tool and doesn’t included in Linux systems, you need to install it using YUM package manager tool. For more information on installation read our article below.
# htop

7. Iotop – Monitor Linux Disk I/O
Iotop is also much similar to top command and Htop program, but it has accounting function to monitor and display real time Disk I/O and processes. This tool is much useful for finding the exact process and high used disk read/writes of the processes.
# iotop

Iotop Command Example Screenshot
8. Iostat – Input/Output Statistics
IoStat is simple tool that will collect and show system input and output storage device statistics. This tool is often used to trace storage device performance issues including devices, local disks, remote disks such as NFS.
# iostat

Linux 2.6.18-238.9.1.el5 (tecmint.com)         09/13/2012

avg-cpu:  %user   %nice %system %iowait  %steal   %idle
           2.60    3.65    1.04    4.29    0.00   88.42

Device:            tps   Blk_read/s   Blk_wrtn/s   Blk_read   Blk_wrtn
cciss/c0d0       17.79       545.80       256.52  855159769  401914750
cciss/c0d0p1      0.00         0.00         0.00       5459       3518
cciss/c0d0p2     16.45       533.97       245.18  836631746  384153384
cciss/c0d0p3      0.63         5.58         3.97    8737650    6215544
cciss/c0d0p4      0.00         0.00         0.00          8          0
cciss/c0d0p5      0.63         3.79         5.03    5936778    7882528
cciss/c0d0p6      0.08         2.46         2.34    3847771    3659776
9. IPTraf – Real Time IP LAN Monitoring
IPTraf is an open source console-based real time network (IP LAN) monitoring utility forLinux. It collects a variety of information such as IP traffic monitor that passes over the network, including TCP flag information, ICMP details, TCP/UDP traffic breakdowns, TCP connection packet and byne counts. It also gathers information of general and detaled interface statistics of TCP, UDP, IP, ICMP, non-IP, IP checksum errors, interface activity etc.
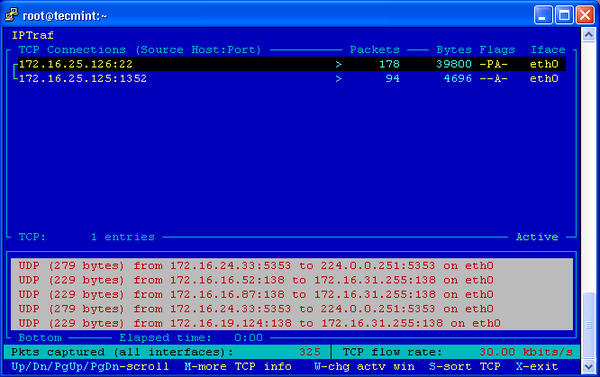
IP Traffic Monitor
10. Psacct or Acct – Monitor User Activity
psacct or acct tools are very useful for monitoring each users activity on the system. Both daemons runs in the background and keeps a close watch on the overall activity of each user on the system and also what resources are being consumed by them.
These tools are very useful for system administrators to track each users activity like what they are doing, what commands they issued, how much resources are used by them, how long they are active on the system etc.
11. Monit – Linux Process and Services Monitoring
Monit is a free open source and web based process supervision utility that automatically monitors and managers system processes, programs, files, directories, permissions, checksums and filesystems.
It monitors services like Apache, MySQL, Mail, FTP, ProFTP, Nginx, SSH and so on. The system status can be viewed from the command line or using it own web interface.
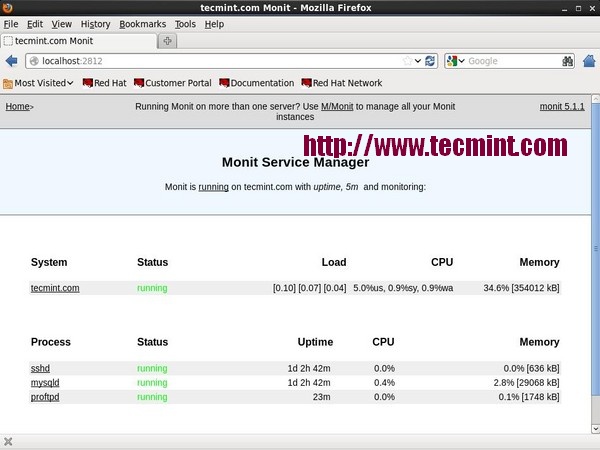
Monit Linux Process Monitoring
12. NetHogs – Monitor Per Process Network Bandwidth
NetHogs is an open source nice small program (similar to Linux top command) that keeps a tab on each process network activity on your system. It also keeps a track of real time network traffic bandwidth used by each program or application.
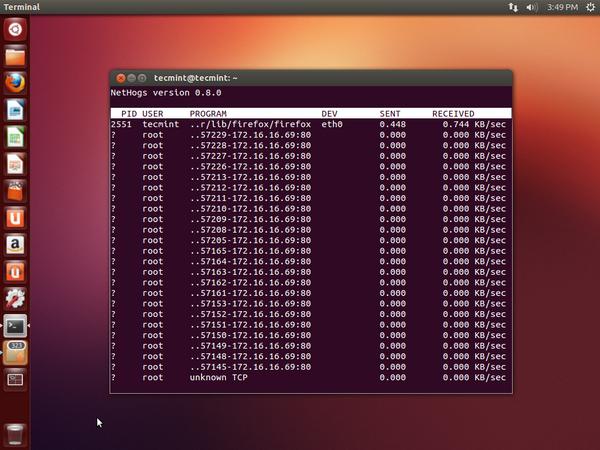
NetHogs Linux Bandwidth Monitoring
We would like to know what kind of monitoring programs you use to monitor performance of your Linux servers? If we’ve missed any important tool that you would like us to include in this list, please inform us via comments and please don’t forget to share it.
0 comments: